It’s an old saying: what gets measured, gets done. It’s something I’ve heard in so many contexts – from the former Director General of the World Health Organization Margaret Chan when I interned there a while back to the ongoing conversation about gender diversity targets on Australian boards and when discussing recent climate change planning and green deals.
And it’s something that is particularly relevant right now in the era of COVID-19 as we attempt to measure cases, deaths and do contact tracing.
Our focus on measurement is generally a practical one. We need measurement in order to understand what’s happening, to take action, to measure efficacy of action, to change direction, to communicate progress…
Who decides what we measure and how? This is at the core of an open debate right now on engaging technology for contact tracing (Read more on this from the 3AI Director Prof Genevieve Bell in her recent article here).
And when we start to dig in to what measurement really means, we end up considering what data is and what it means. Data and sensors were the focus of the third fortnight of the 3AI Master of Applied Cybernetics. Loads of questions raised including:
- Whose data is it?
- How can we understand how representative it is?
- How was it collected?
- Why was it collected?
- How was it processed?
- Who made the decision on what to include and exclude, on how to analyse, on how to visualise, on how to represent?
- And some deeper questions – what is the historical, political and social context of why we collect a certain data type? What biases and structural inequalities are embedded in the data choice?
- How does its storage in a dataset and in a database implicate its future use?
Learnings from this fortnight are far and wide on this topic for me. It opened up so many avenues of exploration that I think there will be much more pondering and sense-making on this to come. For now, I was keen to share three core themes that emerged from this fortnight on data. Perhaps this will also provide some additional lenses as you navigate and consume all sorts of data at this time of the COVID-19 pandemic.
1. Data is not neutral.
If a branding agency was to do a poll of our perceptions of data, its identity would likely evoke the following types of sentiments: data as neutral, as independent, as unarguable / a ‘source of truth’, or in more technical terms as ‘pre-analytical’ or ‘pre-factual’.
What was unravelled in this fortnight was how far from ‘truth’ this notion of data is. Yet how often we start from this presumption. And how damaging the impacts it can have as we interpret data, create knowledge from it and make decisions with it.
As Ellen Broad states in her book “Made by Humans” (2018) :
“Data always has a history, a place, a context. The context in which a data set is created dictates the information considered worth collecting, and what’s overlooked”
Ellen Broad (2018) Provenance and Purpose. In: Made by Humans: the AI Condition. Pp 10-27. Book chapter
The choices made about what is collected and what is excluded from data collection are judgements made by humans based on a range of factors such as:
- practical reasons like ease of collection and compatibility with other datasets and standards;
- political and legal reasons such public opinion, protection laws, regulatory implications or privacy;
- historical reasons such as the way indexes or other measures have been conceived over time, the ways in which measures have been historically collected and reported on;
- and many other factors!
In this way, as Kitchin (2014) summarises, data is a form of power and knowledge. It is never ‘raw’; always ‘cooked’. Data is not benign.
“Data do not simply represent the reality of the world, they are constructions about the world.”
Rob Kitchen (2014). The Data Revolution: Big Data, Open Data, Data Infrastructures & Their Consequences. pp 1-26. Book Chapter
And embedded in those constructions is human’s partial and selective knowledge, their biases (conscious and unconscious) and ultimately their decisions.
Joy Buolamwini makes a similar point in her article “Algorithms aren’t racist, your skin is just too dark” when she talks about camera default settings not picking up darker skin tones. In her words
“We have to keep in mind that default settings are not neutral. They reflect the Coded Gaze, the preferences of those who have the opportunity to develop technology. Sometimes these preferences can be exclusionary.”
Joy Buolamwini (2017) Algorithms aren’t racist, your skin is just too dark. Medium. Blog.
Thus, understanding a range of contextual elements becomes important in understanding the applicability of data to the decision at hand, to the model of the world that you’re choosing to create, to its relevance when making that next algorithm.
Whose is the ‘Coded Gaze’ embedded in your dataset?
What does that gaze choose to include, exclude, analyse, interpret and how and why?
How will your Gaze contribute, further entrench, surface, counteract that gaze?
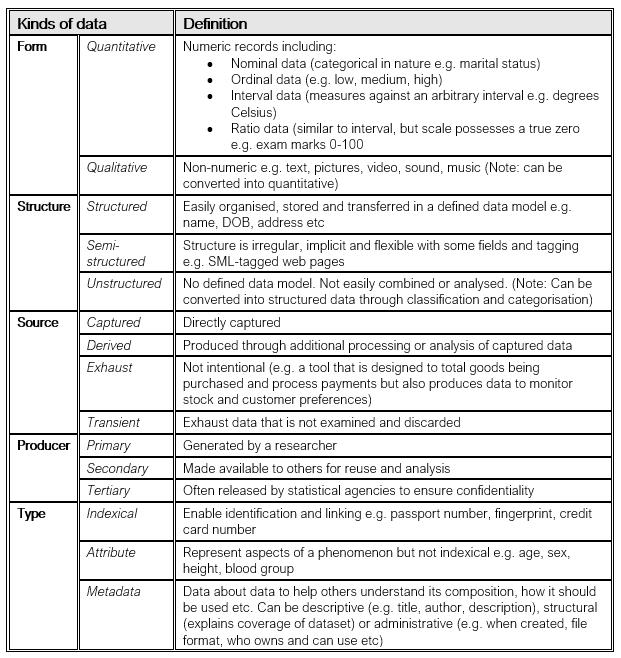
2. Data can be described in a lot of different ways / from a lot of different lenses. This helps to surface a deeper understanding of what the data is and isn’t and what it can and cannot do.
I suppose naively when I thought about data classification categories, my mind goes quantitative and qualitative data and to primary, secondary and tertiary data and at a stretch to structured and semi-structured data. And to be honest, not that much else.
Kitchin (2014)’s book chapter covers so many more kinds of data which I’ve summarised in the table below:
He also raises other perspectives on how to look at data such as:
- Technical perspective – how respresentative is it? how reliable is it? how much error does it have? how uncertain is it? how useable is it?
- Ethical perspective – what are the underlying reasons for the data’s existence?
- Political and economic perspective – is the data considered a public good? Political capital? Intellectual property? A commodity?
- Spatial and/or temporal perspective – how have things changed? (e.g. changes in methods of sorting and analysis, new laws, new statistical techniques, new boundaries or ways of conceptualising the world)
- Philosophical perspective – there are many ways to consider the ontologies and epistemologies of data
As part of this fortnight we deconstructed a dataset (more on this later). What came out of this for me was that having multiple lenses to consider the dataset unlocks new ways of looking at the data, new lines of enquiry, new questions and a better understanding of the data’s limitations and applicability.
As you discover a dataset for a particular purpose, what data kinds might you explore as a way of surfacing its applicability and limitations?
3. Bias has many layers and sources
In a previous life I worked with clients to tackle bias in employment recruitment and retention strategies. So I was interested to see how bias is conceptualised with a computer system in mind. I found Batya Friedman and Helen Nissenmbaum (1996)‘s framing particularly useful which is summarised below into three types of bias:
- Preexisting Bias – bias that is carried into the creation of a system from the existing social institutions, practices or attitudes. This could be the biases of individuals designing the system or biases in society at large (e.g. gender bias).
- Technical Bias – bias that results from technical constraints and considerations of the system. For example from the limitations of the computer tools (hardware, software etc), from an algorithm’s design, from random number generation techniques or from attempts to make human constructs such as discourse useful for computers.
- Emergent Bias – bias that arises in the context of use by users (generally once the design is complete). This can occur due to new knowledge in society that cannot be incorporated into the system design afterwards or a mismatch between the population using the system and the population it was designed for.
When considering unintended consequences of data collection, creation, analysis and use, it can be a helpful framing to consider bias across these dimensions of what existed before the system (pre-existing), what exists because of the system now (technical bias), what could exist because of the system in the future (emergent bias).
What does bias look like in your dataset and in your system?
How can you mitigate its implications?
How can you design for minimising bias?
All in all, it’s been a fascinating tour of the complexities of data and its flowon implications. In an age of standardisation and decoupling of data from its deeper context in order for it to be used ubiquitously, it did raise a range of questions on whether these approaches are actually doing us a disservice when what is really needed is a deeper exploratory understanding of the data across multiple dimensions before applying it somewhere else.
This of course may slow the process down, but ultimately enables a more robust understanding of the boundaries of what’s possible, practical, sustainable, responsible and safe. Decisions on these dimensions might end up in our own ‘gazes’ which we then need to scrutinise in order to understand our awareness of bias and blindspots as well.
Data is certainly not neutral or straightforward!
Neither are the things we measure using it.
What gets measured may well get ‘done’… but what’s really being measured?
What construction of the world is it representing?
What responsibility do we carry to consider the full extent of data’s context and thereby its limitations, implications and potential misuse?
Does it further entrench systems of inequality and/or perpetuate a particular world view?
Does it need to be that way???
These are the types of questions that we continue to explore as Masters of Applied Cybernetics students at the 3A Institute.
For further insights into the 3AI Master of Applied Cybernetics course, take a look at the Institute’s Medium article here.